1
2
3
4
5
6
7
8
9
10
11
12
13
14
15
16
17
18
19
20
21
22
23
24
25
26
27
28
29
30
31
32
33
34
35
36
37
38
39
40
41
42
43
44
45
46
47
48
49
50
51
52
53
54
55
56
57
58
59
60
61
62
63
64
65
66
67
68
69
70
71
72
73
74
75
76
77
78
79
80
81
82
83
84
85
86
87
88
89
90
91
92
93
94
95
96
97
98
99
100
101
102
103
104
105
106
107
108
109
110
111
112
113
114
115
116
117
118
119
|
const fromEntries = entries =>
Object.assign(...entries.map(([ key, value ]) => ({ [key]: value })))
const canvas = document.createElement('canvas');
const ctx = canvas.getContext('2d');
const createNegativePattern = color => {
return new Promise((resolve, reject) => {
const fill = encodeURIComponent(color);
const img = new Image(6, 6);
img.src = `data:image/svg+xml,%3Csvg width='6' height='6' viewBox='0 0 6 6' xmlns='http://www.w3.org/2000/svg'%3E%3Cg fill='${fill}' fill-opacity="1" fill-rule='evenodd'%3E%3Cpath d='M1 0H0 L6 6V5zM0 5v1H1z'/%3E%3C/g%3E%3C/svg%3E`;
img.onload = e => {
const pattern = ctx.createPattern(img, 'repeat');
resolve(pattern);
};
});
};
const negativePatterns = new Map();
['#fc4f3f', '#202126'].forEach(color => {
createNegativePattern(color)
.then(pattern => {
negativePatterns.set(color, pattern);
myChart.setOption(option);
});
});
const BAR_GAP = 0.1;
const CAT_GAP = 0.3;
function generateItemRenderer(index, count, startsWith) {
return function(params, api) {
const x = api.value(0);
const fromY = params.context.lastValue || startsWith;
const toY = api.value(1);
const start = api.coord([x, toY]);
const end = api.coord([x, fromY]);
const toSize = api.size([x, toY]);
const style = api.style();
if (fromY > toY) {
style.stroke = style.fill;
style.fill = negativePatterns.get(style.fill) || '#fff';
}
params.context.lastValue = toY;
const barWidth = toSize[0] * ((1 - CAT_GAP) - BAR_GAP * (count - 1)) / count;
const barOffset = toSize[0] * (CAT_GAP / 2 + BAR_GAP * index) + barWidth * index;
const barShape = fromEntries(Object.entries({
x: Math.round(start[0] - (toSize[0] / 2) + barOffset),
y: Math.round(Math.min(start[1], end[1])),
width: Math.round(barWidth),
height: Math.round(Math.abs(end[1] - start[1]))
})
.map(([k, v]) => [k, Math.round(v)])
.map(([k, v]) => [k, ['x', 'y'].includes(k) ? v + 0.5 : v]))
console.log(barShape);
const bar = {
type: 'rect',
shape: barShape,
style
};
const label = {
type: 'text',
style: {
text: toY.toFixed(0),
textAlign: 'center',
x: barShape.x + barWidth * 0.5,
y: barShape.y + (fromY < toY ? -20 : barShape.height + 8),
fill: style.stroke || style.fill
}
};
return {
type: 'group',
children: [bar, label]
};
};
}
option = {
xAxis: {
name: '时间(s)',
type: 'category',
data: new Array(8).fill(0).map((val, idx) => idx + 1)
},
yAxis: [{
name: '扭矩(N·m)',
min: -100,
max: 100,
interval: 20,
type: 'value'
}, {
show: false
}],
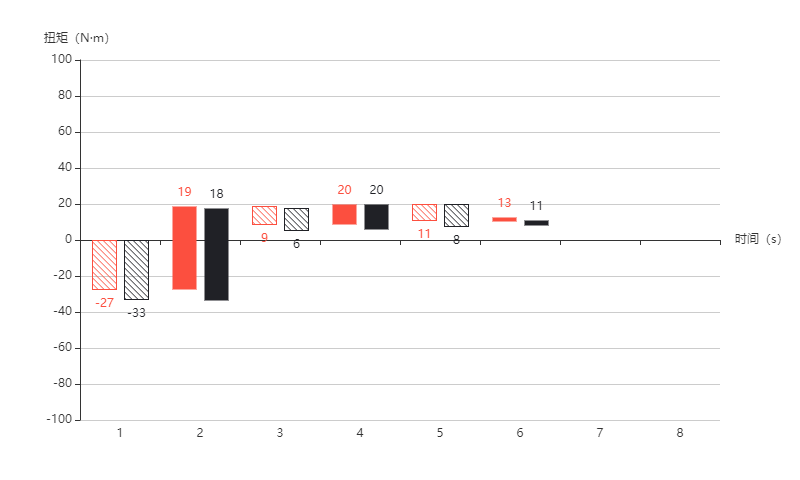
series: [{
name: '扭矩',
type: 'custom',
renderItem: generateItemRenderer(0, 2, 0),
itemStyle: {
normal: { color: '#fc4f3f' }
},
data: [-27, 19, 9, 20, 11, 13]
}, {
name: '扭矩',
type: 'custom',
renderItem: generateItemRenderer(1, 2, 0),
itemStyle: {
normal: { color: '#202126' }
},
data: [-33, 18, 6, 20, 8, 11]
}],
animation: false,
}
|